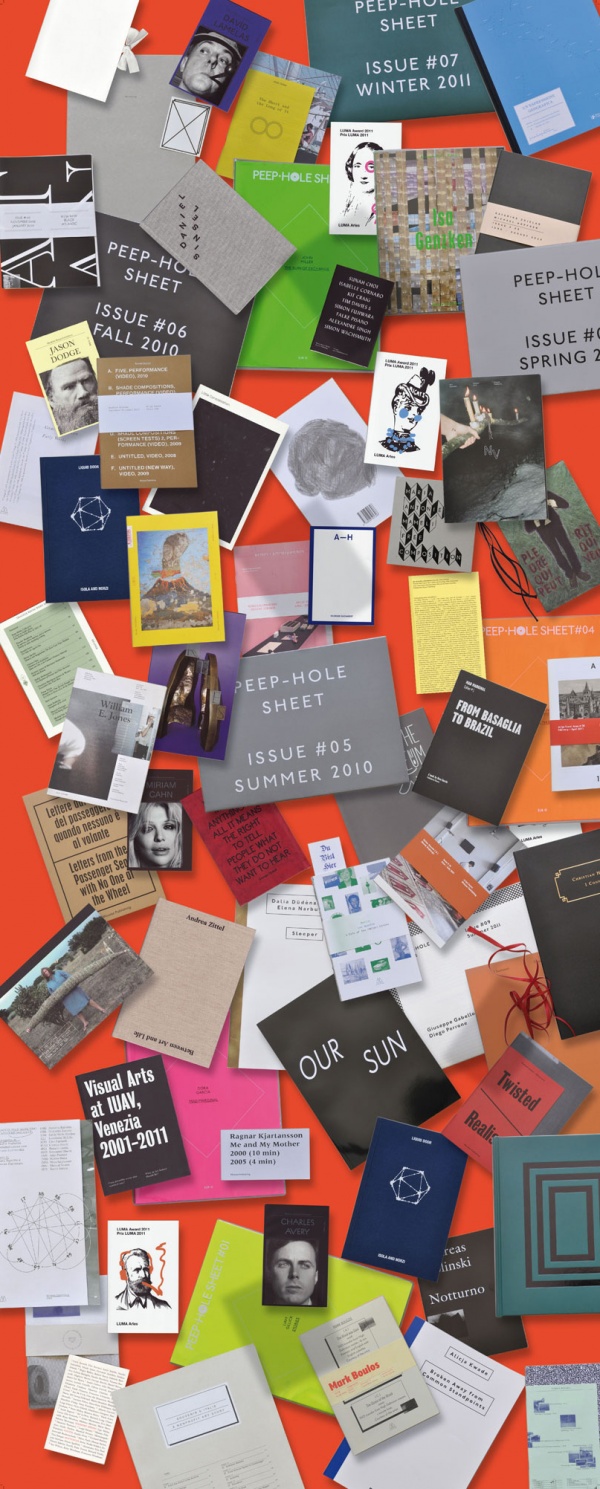
 Assignments / Student Work
MAPPING FOR A NARRATIVE ATLAS
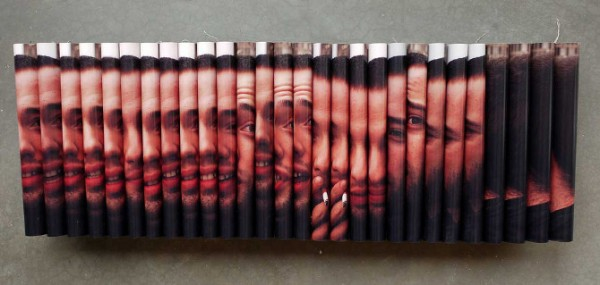
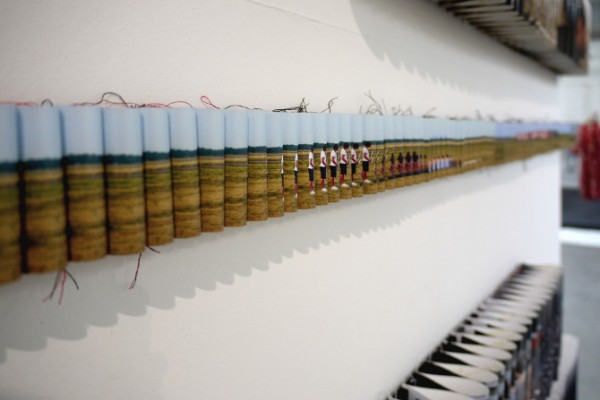
During the Fall Semester 2012 at San Francisco State University, students of “Design and Industry 525: Advanced Graphic Design 03” created a collection of maps, charts and diagrams that centered around the concept of “Food and System.” Each map addressed aspects of their method for investigation by utilizing unique graphic systems to convey information. Students visualized information about food using quantitative and qualitative systems to illustrate their perspective.
A coordinated body of methods, a scheme or plan of procedure was used to organize data from their research. Various production methods were considered and students were encouraged to explore a wide variety of media and design strategies. These methods were evaluated on their effectiveness as generators of visual information with respect to their project goals. These maps of food and system were then compiled into an atlas — a book of maps, charts, illustrations or diagrams united by the subject of food and system.
Project 03 – Narrative Atlas / Research + Documentation
Early in the semester, students collected examples of Atlases and presented their findings to each other. The final project for the course was to build an atlas that contains the maps, charts, diagrams produced to visually display their FOOD + SYSTEM investigations. Process from the course is encouraged to be included to represent the level their research and directions their studies followed.
Atlas Project Presentation: 11/27
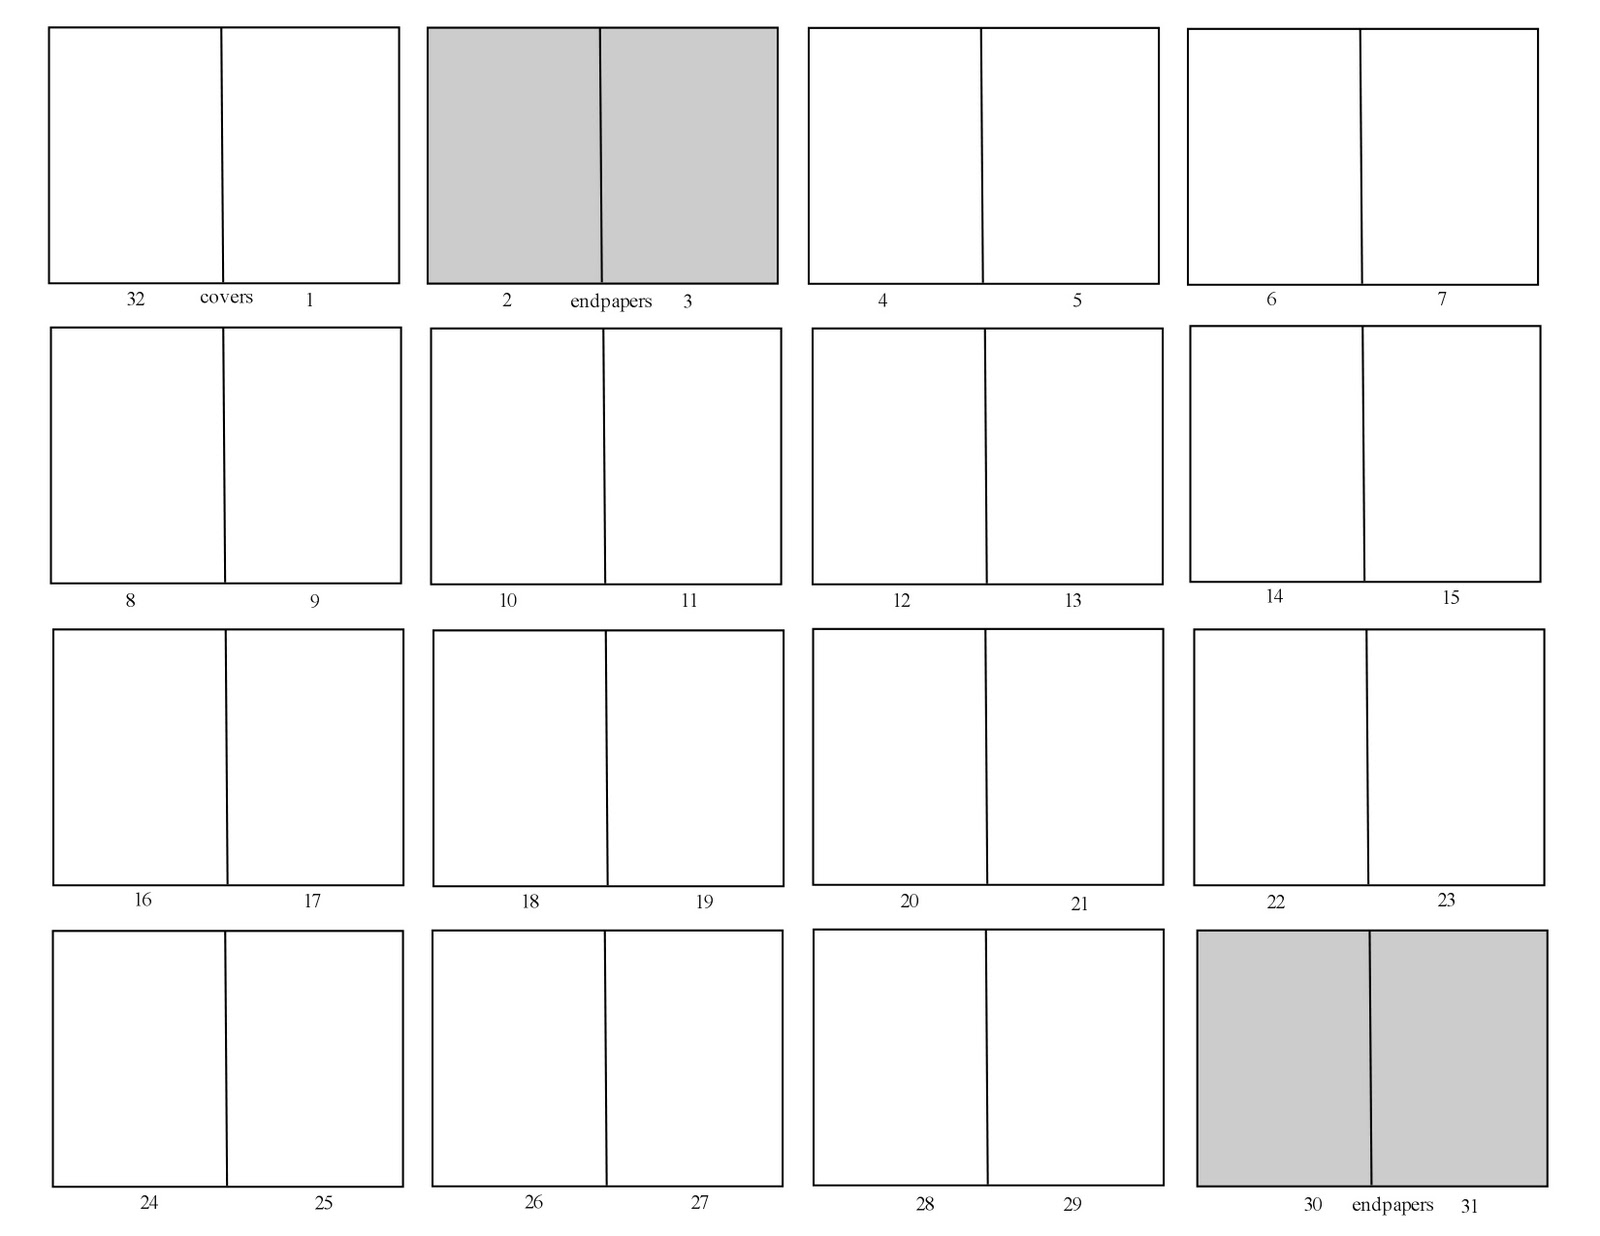
ATLAS Requirements
A. A compilation of your research and production of the qualitative and quantitative maps.
B. A printed and bound publication
C. A
multi-page PDF (upload to iLearn) including:
-
Documentation/image of final pieces. Include previous images of quantitative, qualitatively prototypes.
-
Written introduction to the project
-
Forward by instructor
-
Essay (~1000 words)
-
Guideline explaining and demonstrating the system used to translate (visual if applicable)
Projects
Marielle Atanacio
Dana Bondi
Simone Bradley
Christopher Diaz-Mihell
Sebastian Diaz-Mihell
Nora Gutierrez
Meg Howie
Rachael Koffel
Giacomo Lando
Henry Ngo
Riccardo Pallicelli
Ashley Petty
Roberto Pignataro
Claudia Rodriguez
Paul Skittone
Myles Stephens
Book Design / Resources
1.
MOUSSE Publishing
“Mousse is publisher of catalogues, essays and curatorial projects, artist books and editions. Mousse Publishing follows a publication from its preliminary conception and design to its promotion and distribution, working in close dialogue with clients that include museums, public and private institutions and galleries across the globe. Mousse Publishing's books are internationally distributed by a network of leading distributors and can be found in 270 specialized bookstores and museum bookshops throughout the world.”
http://moussemagazine.it/
2.
Book Map
3. Prototype Demonstration
4. PM Press / Alternative Media
5. Mapping Books
|
|
Amazon Book Map   Close-up of Book Cover Version  Super Close-up of Book Cover Version (email me if you want this level of resolution). Dot Version - Download Full Resolution JPG (8580 x 8580)   About the project: “Aaron Swartz, who runs theinfo.org, contacted me back in January '08 with an interesting data set. He had built a list of 735,323 books by crawling Amazon. Of course a gigantic list is pretty boring, but Aaron had also captured similarity data between books. In particular, he had amassed a whopping 10,316,775 connections (edges) between books Amazon believed were related. This allowed me to throw the data into my old wikiviz engine to spatially layout a huge mosaic of books (I let it run for a 140 hours). Items that were noted as being similar had attractive forces, bringing them together, often into large groups. Unsurprisingly, when we color coded by Amazon book category, there was an obvious coalescence. The way various high-level categorizations mix and meet also seems fairly logical. I produced a few versions of what I am dubbing the Amazon Book Map. The first visualization is a huge mosaic of book covers, tinted by their respective category colors. I can't produce this in one go at full resolution because the memory requires are enormous. The second version uses color-coded dots. The layout (clustering-wise) is decent, but not great. I don't think my algorithm works all that well for highly-unstructured graphs. For those that are curious, I've included a small graph of how the layout converged. ” |
|

Alternative Book Arts
http://www.thisiscolossal.com/2011/08/quasi-cinema/
http://artvis.ro/category/print/
Stacy Asher
Office: FA519
stacyasher@gmail.com
Office + Advising Hours:
5:00-5:30 T + TH in
office hours location
Main DAI Office Rm. FA 121
ABOUT THE BACKGROUND IMAGE:
The graphic is from Hartman Salt's GREATER FOD CULTURE.
http://www.hartmansalt.com/food-culture-analyzed/greater-food-culture/228
“In the spirit of celebrating contemporary food culture, this subway-style map is intended to serve as a snapshot of the main actors, techniques, values and ideas representing today’s culinary zeitgeist. From chefs and the media, to packaged goods and food politics, these “stops” are suggestive of the people, places and things that have influenced the food world (some more directly than others), thereby becoming part of our Greater Food Culture. Take a ride on the Modern Line, stopping off at Thomas Keller and then maybe head onto the Global Line, paying a visit to David Chang. Wherever you go, you’re likely to learn a bit, be entertained and most certainly eat quite well.”